If a picture is truly worth a thousand words, then visualized data is priceless (at least to a facility manager). Think about it: the brain processes images 60,000 times faster than it does text, a fact that highlights how much more successful a picture can be at getting your point across than a string of words. What’s more, images are easier to recall than text, meaning that people have a much better chance of remembering a data point if it’s presented to them as an image.
Data visualization is the process of taking a collection of data points—sometimes hundreds of them, sometimes millions—and turning them into an easy-to-understand graphic. Considering 65% of people are visual learners, the value of contextualizing information as an image cannot be understated. This process can work wonders for the look and feel of reports, as it has the capacity to turn seemingly incoherent numbers into significant company insights. In this way, data visualization is an important tool for facility managers making informed decisions about their office space. Whether you want to see how efficient your office is or you need to visualize how a new office design will look, using reports and analytics that incorporate visuals can help you do your job better.
Data visualization can expose new ways of thinking
Implementing software with data visualization capabilities may help you learn new things about your office. For instance, bringing your data to life as visuals, you can identify patterns that may have been hidden in text, such as particular desks that are more popular with hot desking employees. As you begin collecting data through this software, make sure you are open to all information you receive, and that you are not just looking for data points to validate your existing way of thinking. If you are willing to accept that some aspects of your business may not be up to snuff, you’ll be able to improve processes and make changes. Data visualization can help you by presenting a clear and unmistakable graph.
Graphs can be customized to suit your specific needs

Not all data points are suited to your specific needs—a lot of the information you sift through might be inapplicable to your goals. For instance, if you want to understand the usage rates of a particular boardroom, it doesn’t make sense to look at information gathered across the entire office. Creating graphs can help you isolate exactly which data points are necessary to your current needs.
Visuals can help identify wasted space
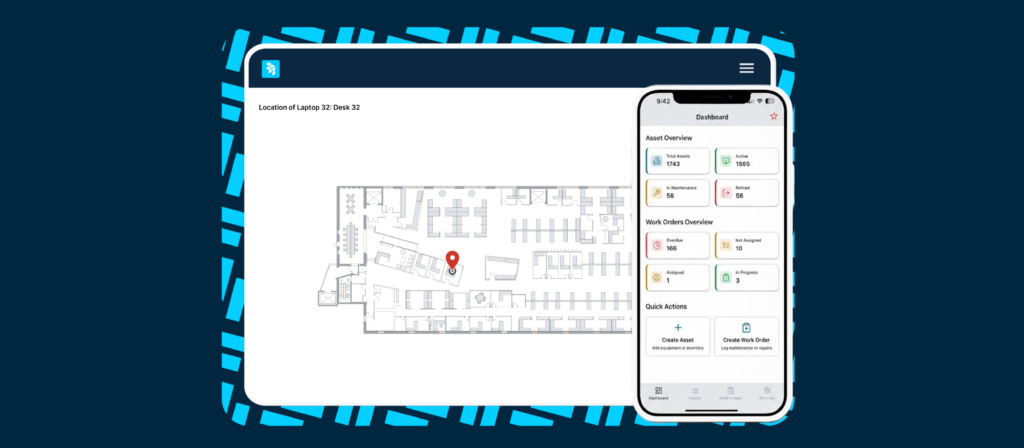
Using data visualization in an office that employs hot desking or room booking policies can help FMs understand which rooms and workspaces are the most popular. If you find very few people are using certain desk types, or if a certain area is booked everyday, it may help you make decisions about what type of workspaces you need to install in an expansion. It can be highly beneficial to study virtual floor plans to get a more holistic view of how the office is being used by employees: is there an area that most employees tend to gravitate towards? Are there neglected areas that could perhaps be put to better use? After all, there’s no better way to understand the success of a new hot desking or room booking policy than to see how employees are adapting.
Data visualization can save you time

Poring over data used to be time-consuming and expensive, but with software that incorporates visuals, you can understand data faster and make more strategic choices. Gone are the days of wondering if and when to move offices, whether the copy machine is being used enough or if you should implement new employee policies. As such, data visualization can help you make choices more efficiently, as it enables you to take in all the related information a lot faster than by reading a series of confusing and overly wordy reports.
Running reports on your office goes beyond simply collecting data—you need to understand this data if it is going to be of any real use to you. Software that goes beyond data collection to include data visualization is the way of the future, as it allows FMs to report on what’s happening in the office in real-time. Investing in software with data visualization is therefore the best way to effectively manage your office space in the present and into the future.
Contact OfficeSpace today to learn more about our reports and analytics functionality and how it can help with your office efficiency.
Photo Credits: Shutterstock / Goran Bogicevic, Shutterstock / Pressmaster, Shutterstock / Jacob Lund

Get exclusive insights on workplace trends
Continue reading